In this lesson we review cube roots and absolute value in preparation for studying the graphs of eight basic functions. When considering the two rational functions, we introduce the notions of vertical and horizontal asymptotes. Note that these topics should be treated intuitively and numerically; in particular we do not explicitly discuss limits. Nor do we use the terminology of domain and range, as these are topics for precalculus. At this stage, students still think of functions and graphs pointwise, and will only gradually progress to a more global view.
After doing a few examples of simplifying expressions involving cube roots and absolute values, let the class work in groups on the Activities. You might display examples of students’ graphs and discuss their strengths and weaknesses.
Activity5.3.1.Some Powers and Roots.
Complete the table of values for the two functions
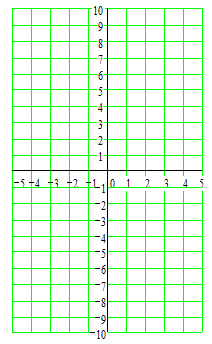
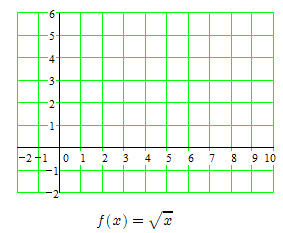
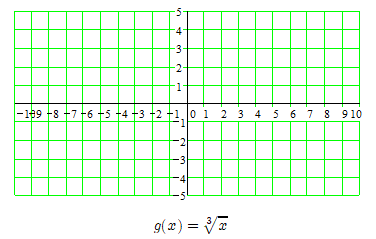
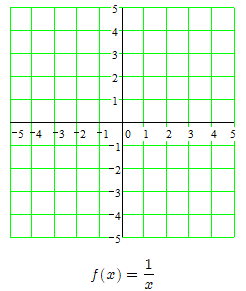
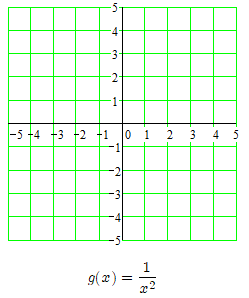
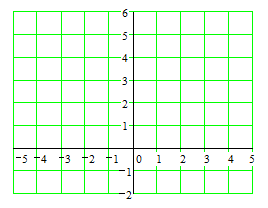
Plot the points from the table and connect them with smooth curves.
As \(x\) increases through larger and larger values, what happens to the values of \(y = \dfrac{1}{x}\) ?
What happens to \(y\) as \(x\) decreases through larger and larger negative values (that is, for \(x=-5,~-6,~-7\) ...)?
Will the graph of \(y = \dfrac{1}{x}\) ever touch the \(x\)-axis? Why or why not?
Repeat part(c) for the graph of \(y = \dfrac{1}{x^2}\text{.}\)
Next we’ll examine the graphs near \(x=0\text{.}\) Evaluate \(f(x)=\dfrac{1}{x}\) for several \(x\)-values close to zero and complete the table below. What happens to the values of \(y=\dfrac{1}{x}\) as \(x\) approaches zero?
\(x\)
\(f(x)=\dfrac{1}{x}\)
\(-2\)
\(\hphantom{00000}\)
\(-1\)
\(\hphantom{00000}\)
\(-0.1\)
\(\hphantom{00000}\)
\(-0.01\)
\(\hphantom{00000}\)
\(-0.001\)
\(\hphantom{00000}\)
\(x\)
\(f(x)=\dfrac{1}{x}\)
\(2\)
\(\hphantom{00000}\)
\(1\)
\(\hphantom{00000}\)
\(0.1\)
\(\hphantom{00000}\)
\(0.01\)
\(\hphantom{00000}\)
\(0.001\)
\(\hphantom{00000}\)
Extend your graph to reflect your answer. Will the graph ever touch the \(y\)-axis? Why or why not?
Repeat part (d) for the graph of \(g(x)=\dfrac{1}{x^2}\text{.}\)
\(x\)
\(g(x)=\dfrac{1}{x^2}\)
\(-2\)
\(\hphantom{00000}\)
\(-1\)
\(\hphantom{00000}\)
\(-0.1\)
\(\hphantom{00000}\)
\(-0.01\)
\(\hphantom{00000}\)
\(-0.001\)
\(\hphantom{00000}\)
\(x\)
\(g(x)=\dfrac{1}{x^2}\)
\(2\)
\(\hphantom{00000}\)
\(1\)
\(\hphantom{00000}\)
\(0.1\)
\(\hphantom{00000}\)
\(0.01\)
\(\hphantom{00000}\)
\(0.001\)
\(\hphantom{00000}\)
State the intervals on which each graph is increasing. Write a few sentences comparing the two graphs.
Activity5.3.3.Absolute Value.
Complete the table of values for the two functions