In this Lesson we use function notation with graphs, construct the graph of a function, use the vertical line test, and solve equations and inequalities graphically.
Section 5.2 Graphs of Functions
Activity 5.2.1. The Graph of a Function.
The graph shows the U.S. unemployment rate as a function of time, \(U=f(t)\text{,}\) for the years 1985-2004.
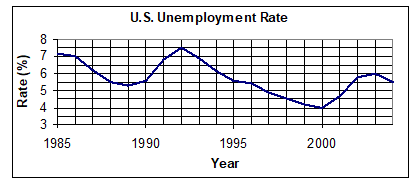
- Evaluate \(f(1993)\text{,}\) and explain its meaning for this problem.
- When did the unemployment rate reach its highest value, and what was its highest value? Write your answer with function notation.
- When did the unemployment rate fall to its lowest value, and what was its lowest value? Write your answer with function notation.
- Solve the equation \(f(t)=4.5\text{,}\) and explain its meaning for this problem.
-
Over what intervals was the unemployment rate increasing?
Activity 5.2.2. Functions Defined by Graphs.
The figure shows the graph of the function \(y=F(s)\text{.}\) A solid dot means that the point is part of the graph, and an open circle means that the point is not part of the graph.
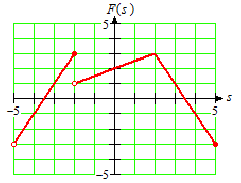
- Find \(F(-3), F(-2)\) and \(F(2)\text{.}\)
- For what value(s) of \(s\) is \(F(s)=-1\) ?
- Find the maximum value of \(F(s)\text{.}\) For what value(s) of \(s\) does \(F\) take on its maximum value?
- Find the minimum value of \(F(s)\) For what value(s) of \(s\) does \(F\) take on its minimum value?
Activity 5.2.3. Solving Equations and Inequalities.
Each figure shows a graph of
\begin{equation*}
B = f(p)= \dfrac{1}{3}p^3 - 3p + 2
\end{equation*}
Use the graph to solve the following equations and inequalities. Show your work on the graph. Write your answers in interval notation.
- \(\dfrac{1}{3}p^3 - 3p + 2 = 6\)
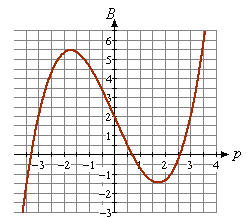
- \(\dfrac{1}{3}p^3 - 3p + 2 = 2\)
- \(\dfrac{1}{3}p^3 - 3p + 2 \lt 2\)
Subsection 5.2.1 Check Your Understanding
- In Activity 1, what is the input variable, and what is the output variable?
- In Activity 1d, how did you solve the equation?
- Is it possible for a function to have more than one maximum value? Is it possible for a function to take on its maximum value at more than one point?
- In Activity 3, how do you know that the graph represents a function?
Subsection 5.2.2 Wrap-Up
In this Lesson, we worked on the following skills and goals related to functions:
- Use function notation to label points on a graph
- Interpret the coordinates of a point on the graph of a function
- Use the vertical line test
- Solve an equation or inequality graphically
Subsection 5.2.3 Questions for Writing or Discussion
- Describe how to find the value of \(f(3)\) from a graph of \(f(3)\text{.}\)
- Explain how to construct the graph of a function from its equation.
- Explain how to use the vertical line test.
- Explain how to solve an inequality by using a graph.
Concept Questions.
-
If \(f(8)=2\text{,}\) what point lies on the graph of \(f\text{?}\)
- \(\displaystyle (8,2)\)
- \(\displaystyle (2,8)\)
- Both (a) and (b).
- All points between 2 and 8.
-
Write an equation that says \((8,17)\) lies on the graph of \(f\text{.}\)
- \(\displaystyle 8+17=g\)
- \(\displaystyle g+8=17\)
- \(\displaystyle g(8)=17\)
- \(\displaystyle 8=\dfrac{17}{g}\)
-
Which of the following is true?
- It is not possible for the function to take on the same \(y\)-value at two different \(x\)-values.
- The maximum value of \(y=f(x)\) may occur at two different \(x\)-values.
- The maximum value of the function \(y=f(x)\) is the largest \(x\)-value that appears on the graph.
- \(f(x)=0\) at the \(x\)-intercept of \(y=f(x)\text{.}\)
-
When is a function called decreasing?
- If its \(x\)-values increase from left to right.
- If its \(y\)-values decrease when its \(x\)-values decrease.
- If its \(y\)-values decrease when its \(x\)-values increase.
- If the graph lies below the \(x\)-axis.

