This Lesson provides a brief introduction to linear regression. We begin by considering data that are "almost" linear and fit a regression line by eye. Explain to students that their answers may differ slightly; nonetheless a line can be a bad fit. Show them how to adjust their line so that the same number of data points lie above the line and below the line.
You will also need to emphasize that the line of best fit need not pass through any of the data points, and that to find the equation of the regression line, they must use points on the line, not data points. One goal of this lesson is for students to practice using the point-slope formula to find the equation for a line through two points.
Activity 2 demonstrates least-squares regression with technology. If you are using technology for regression in your course, you should arrange for students to have the data already entered or easily downloaded on their devices. Alternatively, you could just demonstrate the technology for the class. We don’t think that students should be required to find regression equations for data sets of this size. However, they should be asked to read and interpret information from the graph.
Activity2.1.1.Line of Best Fit.
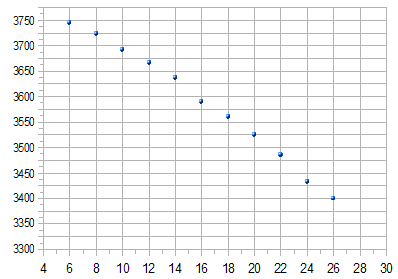
The scatterplot shows the area, \(A\text{,}\) of the Amazon rain forest remaining, in thousands of square kilometers, \(t\) years after 1980.
\(t\)
\(A\)
6
3745
8
3734
10
3692
12
3667
14
3667
16
3590
18
3560
20
3524
22
3485
24
3432
26
3400
Use a straightedge to draw a line of best fit for the data.
Choose two points on the regression line. (Do not choose data points; choose points on your line.)
Points:
Use the point-slope formula to find the equation of your regression line.
Use your regression equation to predict when the rain forest will be completely destroyed.
Comment on your results: What factors might affect your prediction?
Activity2.1.2.Interpolation and Extrapolation.
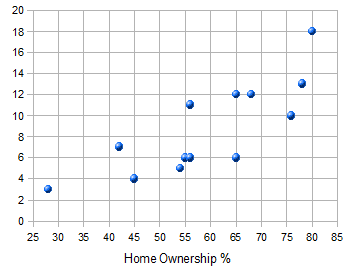
It has been proposed that unemployment is higher in communities where a large percentage of workers own their own homes. The data show the percent of owner-occupied housing and the unemployment rate in several European nations. We will calculate a regression line to model the data.
Country
Home Owners %
Unemp. Rate %
Austria
54
5
Belgium
65
12
Denmark
65
6
Finland
78
13
France
56
11
Great Britain
65
6
Ireland
76
10
Italy
68
12
Netherlands
45
4
Spain
80
18
Sweden
56
6
Switzerland
28
3
West Germany
42
7
Use a straightedge to draw a line of best fit for the scatterplot.
Use technology to find the equation of the least-squares regression line. (Or record the equation provided by your instructor.) Round the coefficients to two decimal places.
Evaluate the least-squares formula for 40% home ownership and for 70% home ownership.
Use the values from part (c) to graph the least-squares regression line on the scatterplot, and compare to your line of best fit.
What is the slope of the least-squares regression line? What is its meaning for this situation?
What is the vertical intercept of the least-squares regression line? What is its meaning for this situation?
What unemployment rate does the model predict for a society with 100% home ownership?
Subsection2.1.1Check Your Understanding
Should you adjust a line of best fit so that it passes through two of the data points? Why or why not?
In Activity 1, why don’t we use data points to find the equation of the line of best fit?
In Activity 2, how did your line of best fit compare to the least-squares regression line?
In which part(s) of Activity 2 did you use interpolation, and in which part(s) did you use extrapolation?
Subsection2.1.2Wrap-Up
In this Lesson, we worked on the following skills and goals related to linear models:
Sketch a line of best fit for a scatterplot
Find an equation for a line of best fit
Make estimates using interpolation and extrapolation
Use technology for least-squares regression
Subsection2.1.3Questions for Writing or Discussion
Describe a strategy for sketching a line of best fit by eye.
Should you expect the data points on a scatterplot to satisfy the regression equation? Why or why not?
Explain the difference between interpolation and extrapolation.
Describe a way to use technology to find the equation of a line through two points.
Concept Questions.
Can two points on a scatterplot have the same \(x\)-coordinate? Can two points have the same \(y\)-coordinate?
Yes, Yes
Yes, No
No, Yes
No, No
If you add more data points to the scatterplot, could the regression line change?
Yes
No
How many data points must a good regression line pass through?
Three
Two
One
None
We can estimate the regression equation by drawing the line that passes through: